%20(2).png)
A new methodology to identify hidden customer demand peaks for global BNPL clients.
Reducing Decision Ambiguity in Global Campaign Planning
Over five years at Mastercard, I worked closely with a BNPL client across Australia, the United States, and the United Kingdom. A recurring challenge was selecting the right merchants for seasonal promotions.
Planning teams relied on visual trend charts, but decisions were often reactive and subjective. It was difficult to separate true seasonal patterns from noise, leading to inconsistent choices across markets.
This revealed the need for a more stable and reliable approach. I set out to reduce cognitive load, standardize decisions, and predict which merchants were most likely to lift during key promotional periods. This became the foundation of the Seasonality Index methodology.
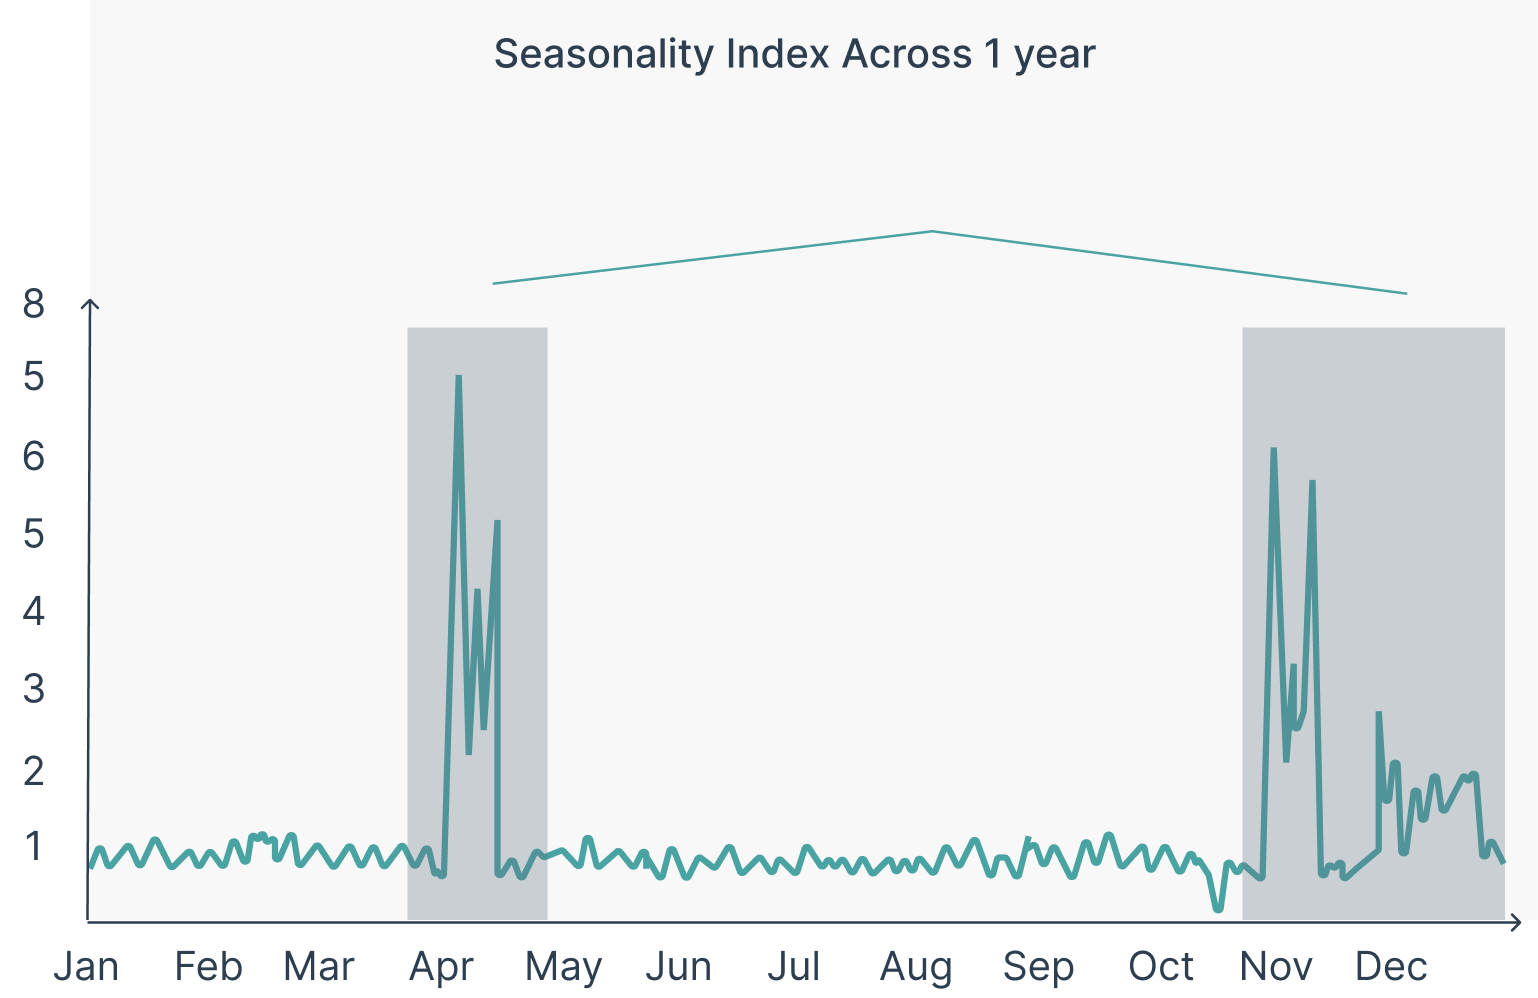
To isolate true seasonality from noise, I established a 365 day historical baseline for each merchant.
By comparing this baseline with the same promotional period from the prior year, I identified true seasonal lift based on behavior rather than visual interpretation.
Raw lift percentages were not comparable across merchants with different sizes and volatility levels. To address this, I designed a normalized scoring system that standardizes year over year behavior around a mean of 1.
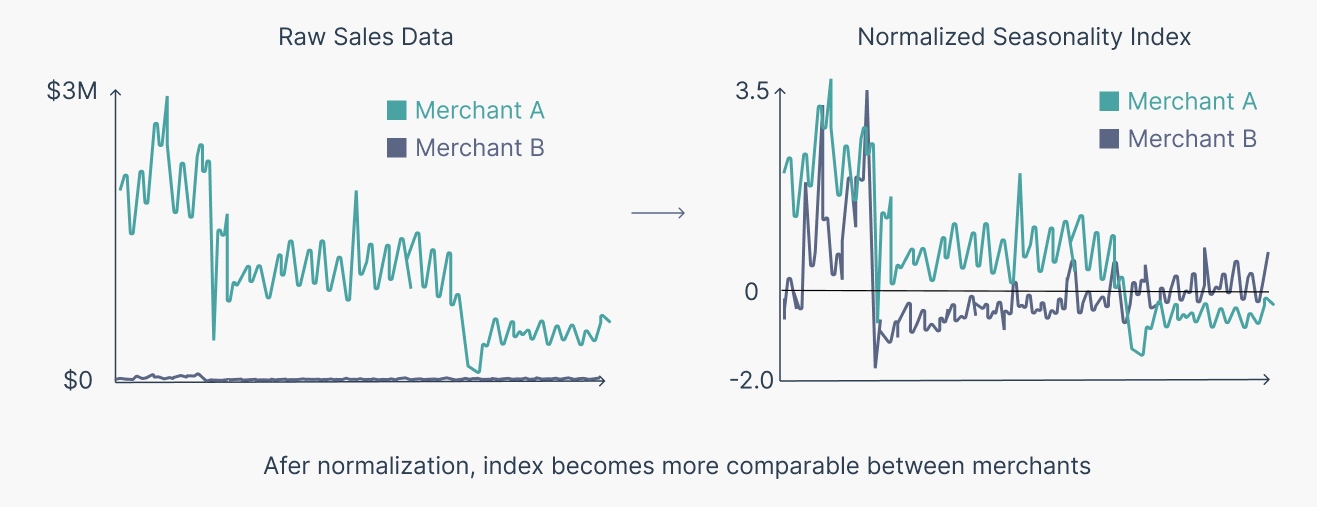
This transformation condensed uneven transaction patterns into a single, interpretable metric. As a result, the team could evaluate small local shops and national retailers on the same basis, replacing guesswork with clear, actionable evidence.
To ensure the index was predictive rather than descriptive, I validated it across three years of historical promotional cycles covering ten campaigns. The results were strong:
Promotions launched when the Seasonality Index exceeded 1.1 achieved over 70 percent higher sales growth than typical A/B testing outcomes.
The index consistently matched real promotional performance and outperformed selection based on trend charts.
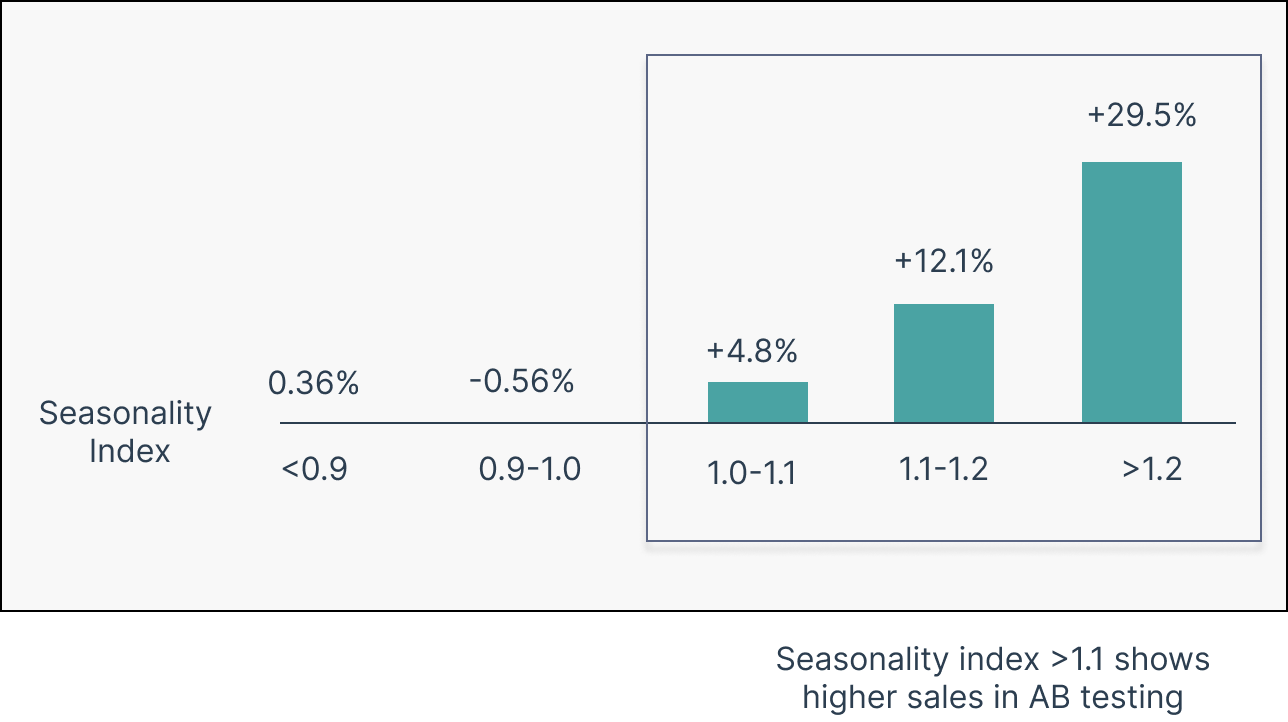
This validation showed that the methodology was both accurate and actionable.
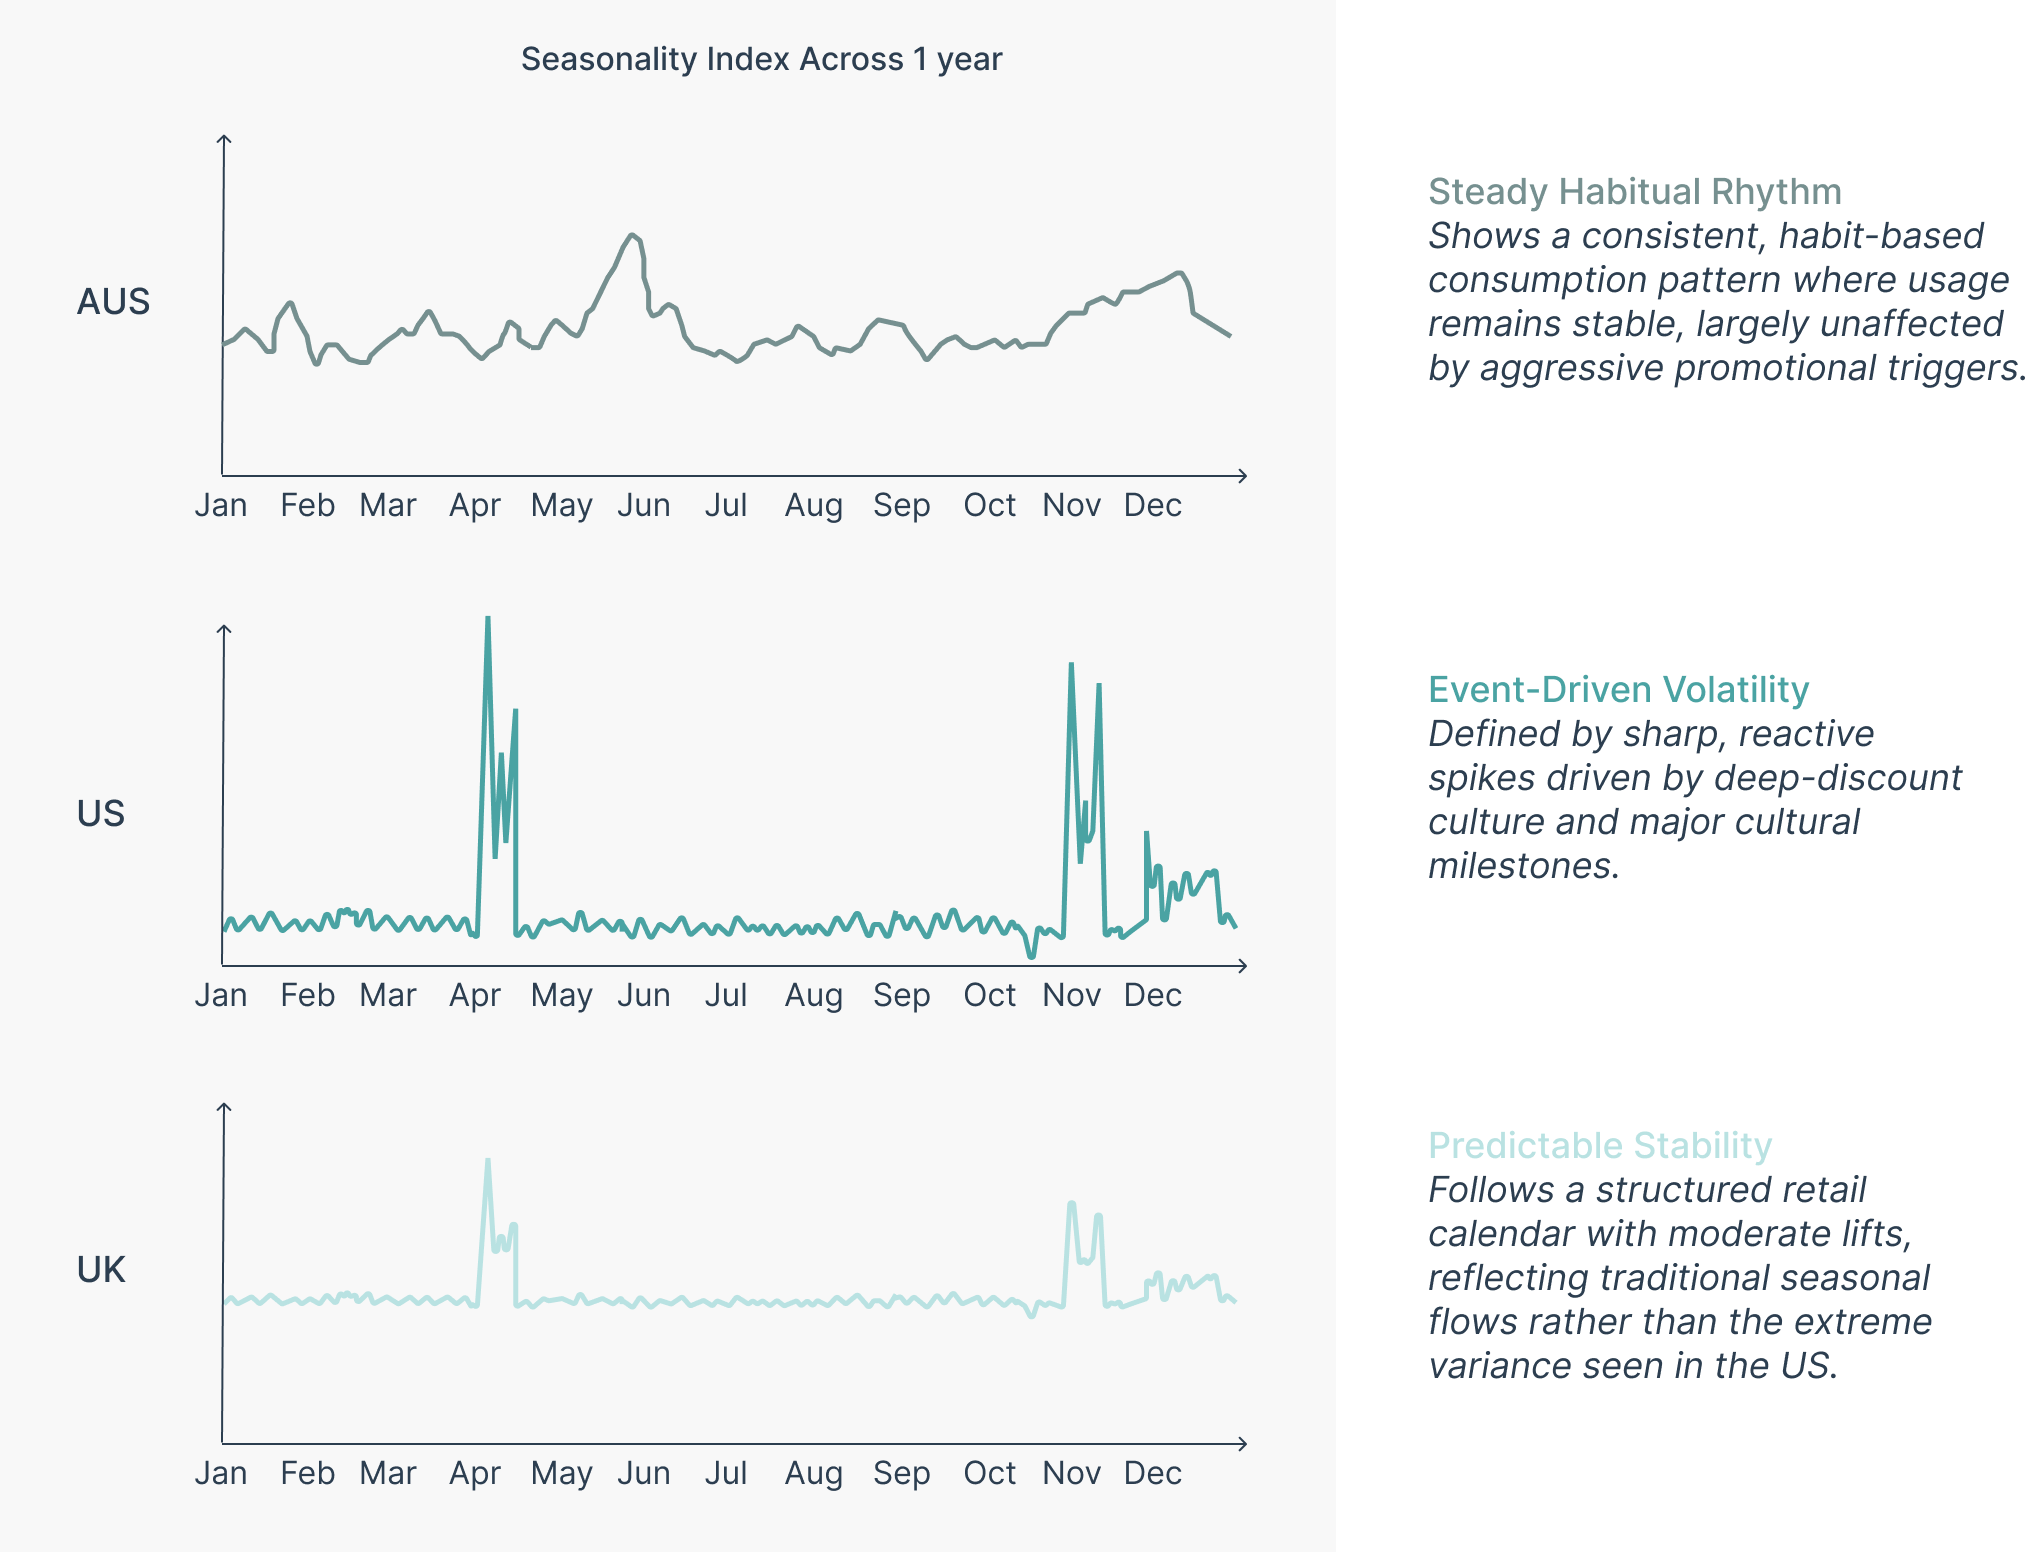
Applying the Seasonality Index across regions revealed a clear insight. Seasonality is shaped by culture. US consumers respond strongly to holidays and deep discounts, creating higher volatility, while AU and UK markets follow steadier and more predictable patterns.
Raw lift percentages were not To make the methodology useful across regions, I built market specific calibrations into the framework. This required more than statistical adjustment. It required understanding the behavioral context behind the data. I validated these patterns through contextual triangulation across three lenses.comparable across merchants with different sizes and volatility levels. To address this, I designed a normalized scoring system that standardizes year over year behavior around a mean of 1.
Cultural mapping: Checked whether signals aligned with known shopping behaviors, such as US holiday surges versus steadier AU patterns.
Strategy review: Analyzed merchant promotion tactics to understand regional differences in discount timing and depth.
Bias check: Compared co marketing investments to confirm that observed lift reflected consumer behavior rather than paid amplification.
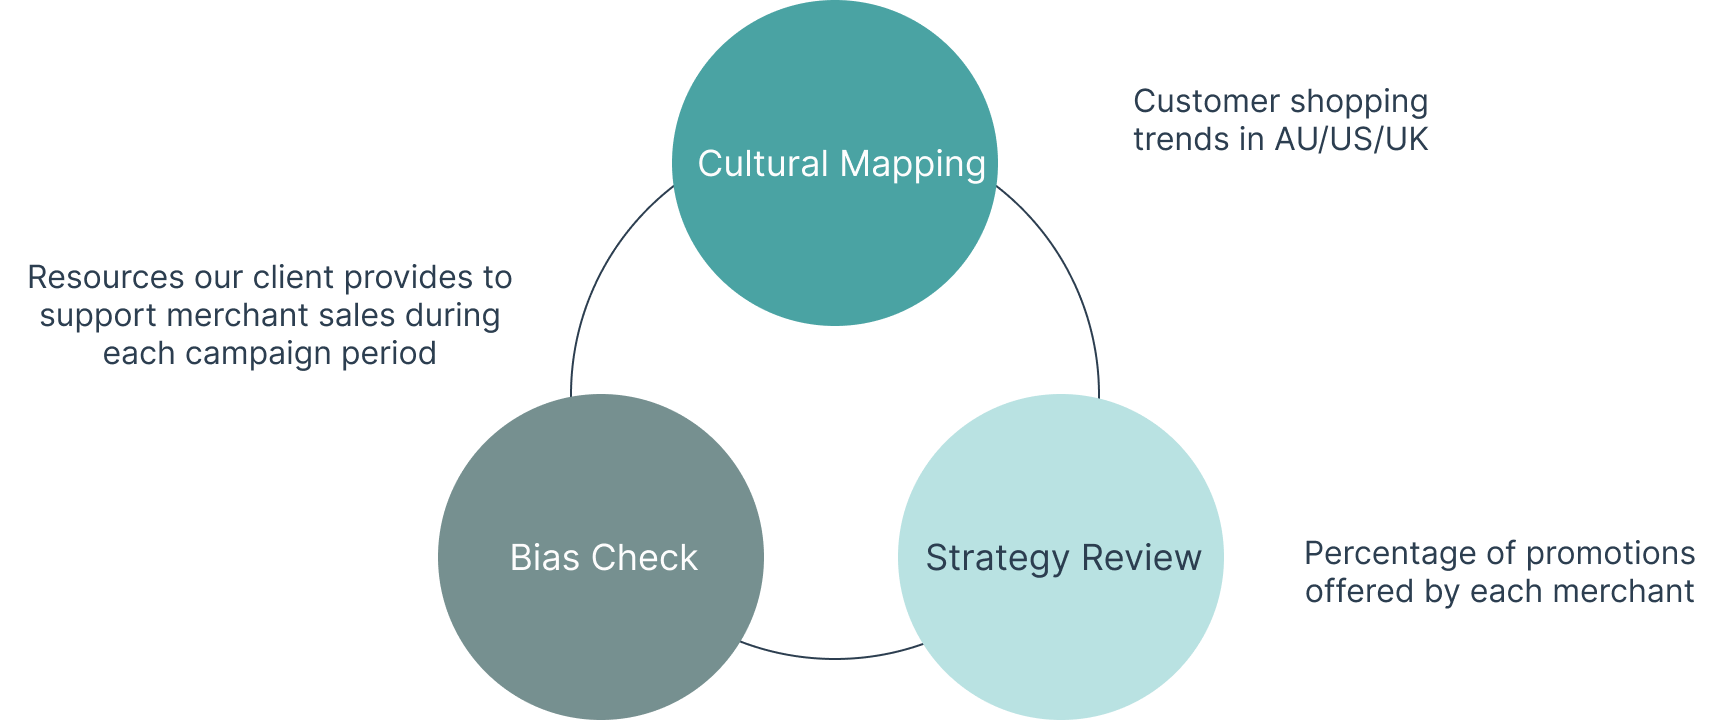
These layers allowed us to set market specific thresholds for the Seasonality Index, making the tool both behaviorally grounded and operationally credible for each regional team.
Because the methodology would guide decisions by C level leaders across the US, UK, and AU, clarity mattered as much as accuracy. I translated the statistical framework into a simple narrative that explained why it worked, linking baseline, seasonal lift, and normalization to real merchant behavior.
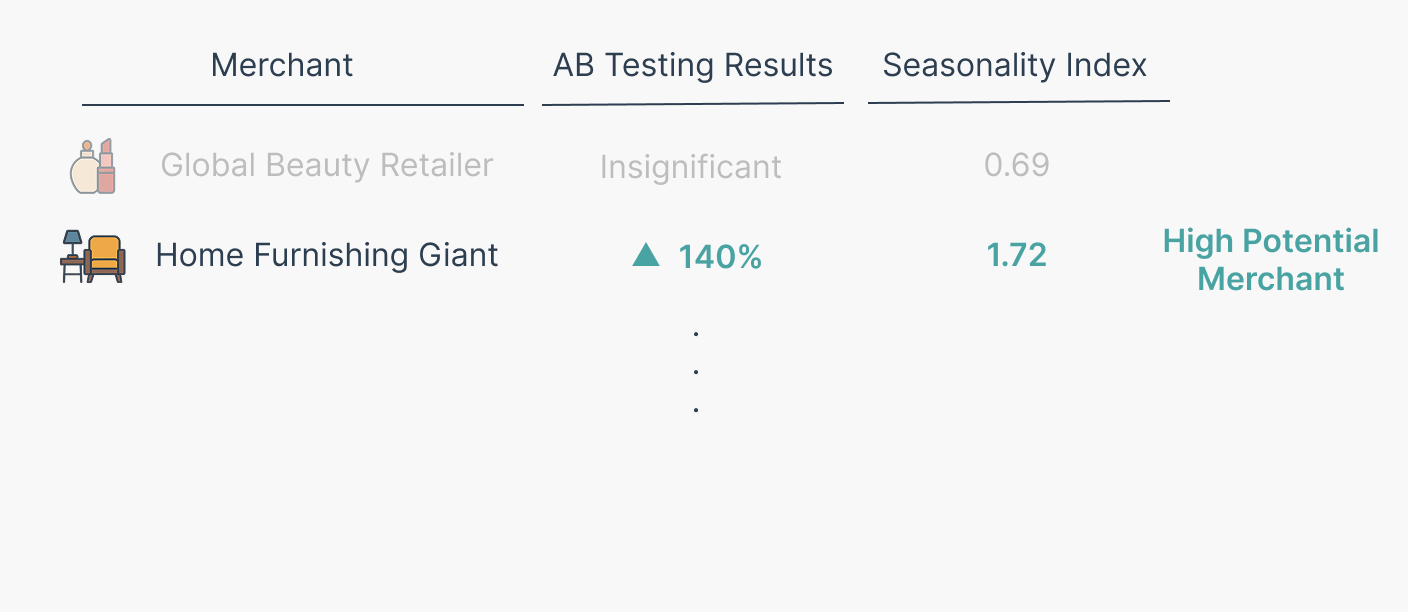
By showing a direct link between the Index value of 1.72 and a 140 percent sales lift, I built a feedback loop that helped skeptics trust the model.
Instead of equations, I used visual comparisons and concrete examples so non technical leaders could grasp the logic at a glance. This helped senior decision makers build trust quickly and enabled adoption ahead of the US Back to School pilot.
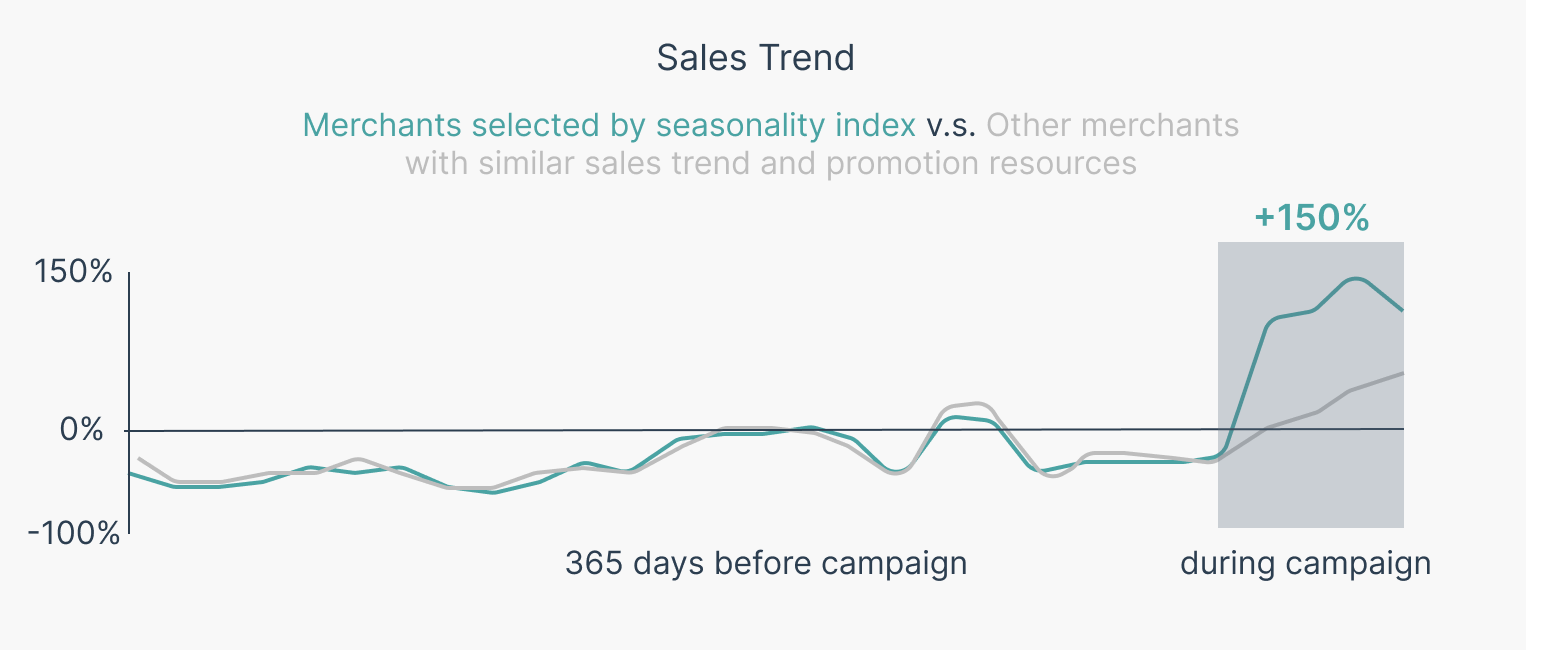
We applied the methodology to the US Back to School campaign. Using the Seasonality Index, we identified merchants with the highest predicted lift.The results exceeded expectations:
Selected merchants delivered 150 percent higher performance than the initial forecast.
Following this outcome, the client adopted the methodology as part of their seasonal planning framework, and internal teams began using it to guide merchant selection for future campaigns.
This project sat at the intersection of data science and design strategy.
While the methodology helped standardize decision making across markets, it also revealed the limits of quantitative signals. The index showed what people were doing, such as why US consumers surge during holidays, but it could not fully explain why they behave that way. Data reveals patterns, but only direct conversation and empathy uncover the motivations behind them.
I also learned that a methodology is a living system. It must be continuously tested, updated, and questioned as cultures evolve. Without this, even a well designed framework can slowly drift into bias.
Ultimately, this project taught me that adaptability is a design choice. The value was not only in building a statistical model, but in creating a framework flexible enough to remain meaningful as the world changes.